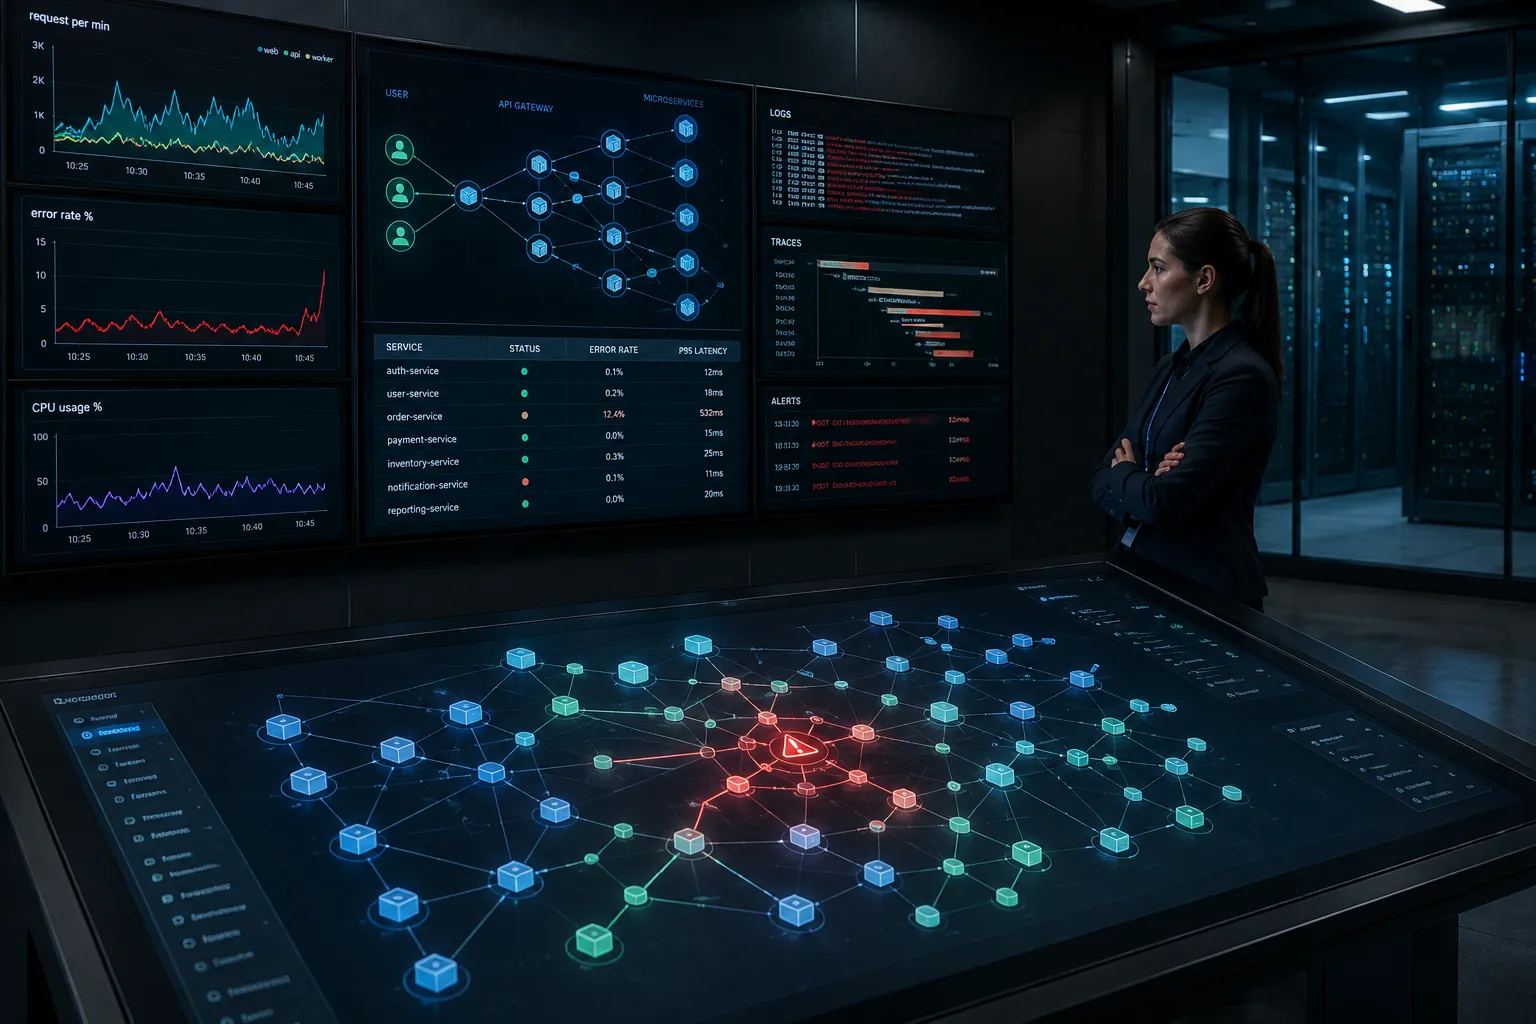

AI-driven IT operations (AIOps) applies machine learning and analytics to operational data — metrics, logs, traces, and topology — to detect anomalies, correlate alerts, predict failures, and automate remediation. It reduces mean time to detect (MTTD) and mean time to resolve (MTTR) while optimizing infrastructure costs.
What Is AIOps?
AIOps (Artificial Intelligence for IT Operations) platforms ingest heterogeneous operational data — metrics from Prometheus/Datadog, logs from Elastic/Splunk, traces from Jaeger/Zipkin, topology from CMDB and cloud APIs — and apply machine learning to surface insights humans cannot find at scale.
Why Traditional Monitoring Falls Short
Traditional monitoring is threshold-based: alert when CPU > 80%, disk > 90%. This generates noise (alert storms during batch jobs) and misses context (CPU spike caused by database lock contention). Operators drown in alerts while root cause remains hidden.
Key Challenges
Data Silos
Metrics, logs, traces, and topology live in separate tools. Correlating a latency spike in the APM tool with a config change in the CMDB requires manual pivoting.
Alert Fatigue
Static thresholds produce false positives. A 2023 survey found 64% of alerts are ignored. Critical signals get lost.
Skills Gap
Senior operators who understand system interactions are retiring. Junior staff lack the mental model to connect disparate signals.
Recommended AIOps Architecture
Unified Data Lake
Ingest all telemetry into a single store (data lakehouse). Normalize schemas. Enrich with topology (service dependencies, business criticality, ownership).
Multi-Layered ML
- Anomaly detection — unsupervised learning on metric baselines (seasonal, trend).
- Log clustering — group similar log patterns, surface rare events.
- Topological correlation — trace alert propagation through service graph.
- Probable root cause — rank candidates by centrality, change correlation, historical precedent.
Automated Remediation
Connect insights to runbook automation (Ansible, ServiceNow, custom APIs). Start with safe actions: restart pod, clear cache, scale replica set. Require approval for destructive actions.
Capacity Optimization
Forecast resource demand using time-series ML. Right-size cloud instances. Identify zombie assets. Simulate "what-if" scenarios before procurement.
Implementation Roadmap
- Months 1-2: Centralize logs and metrics. Deploy OpenTelemetry collectors. Build service topology.
- Months 3-4: Enable anomaly detection on golden signals (latency, traffic, errors, saturation). Tune thresholds.
- Months 5-6: Correlate alerts into incidents. Implement probable root cause ranking.
- Months 7+: Automate Tier 1 remediation. Expand to capacity planning and cost optimization.
| Capability | Traditional Monitoring | AIOps Platform |
|---|---|---|
| Data Sources | Metrics only | Metrics, logs, traces, topology, events |
| Alerting | Static thresholds | ML-based anomaly detection + correlation |
| Incident Triage | Manual, 30-60 min | Automated correlation, probable root cause in seconds |
| Remediation | Manual runbooks | Automated playbooks with guardrails |
| Capacity Planning | Spreadsheet-based | ML forecasting + what-if simulation |
| Skill Requirement | Deep system expertise | Platform augments junior analysts |
Traditional monitoring vs. AIOps capabilities comparison
Practical Recommendations
- Adopt OpenTelemetry as the universal instrumentation standard — vendor-neutral, future-proof.
- Build a service topology graph (CMDB + cloud discovery + Kubernetes) before enabling correlation.
- Start anomaly detection on business-critical services only. Expand gradually to reduce noise.
- Define clear automation boundaries: what runs automatically, what requires approval, what is never automated.
- Measure MTTD and MTTR weekly. Target 50% reduction in 12 months.