
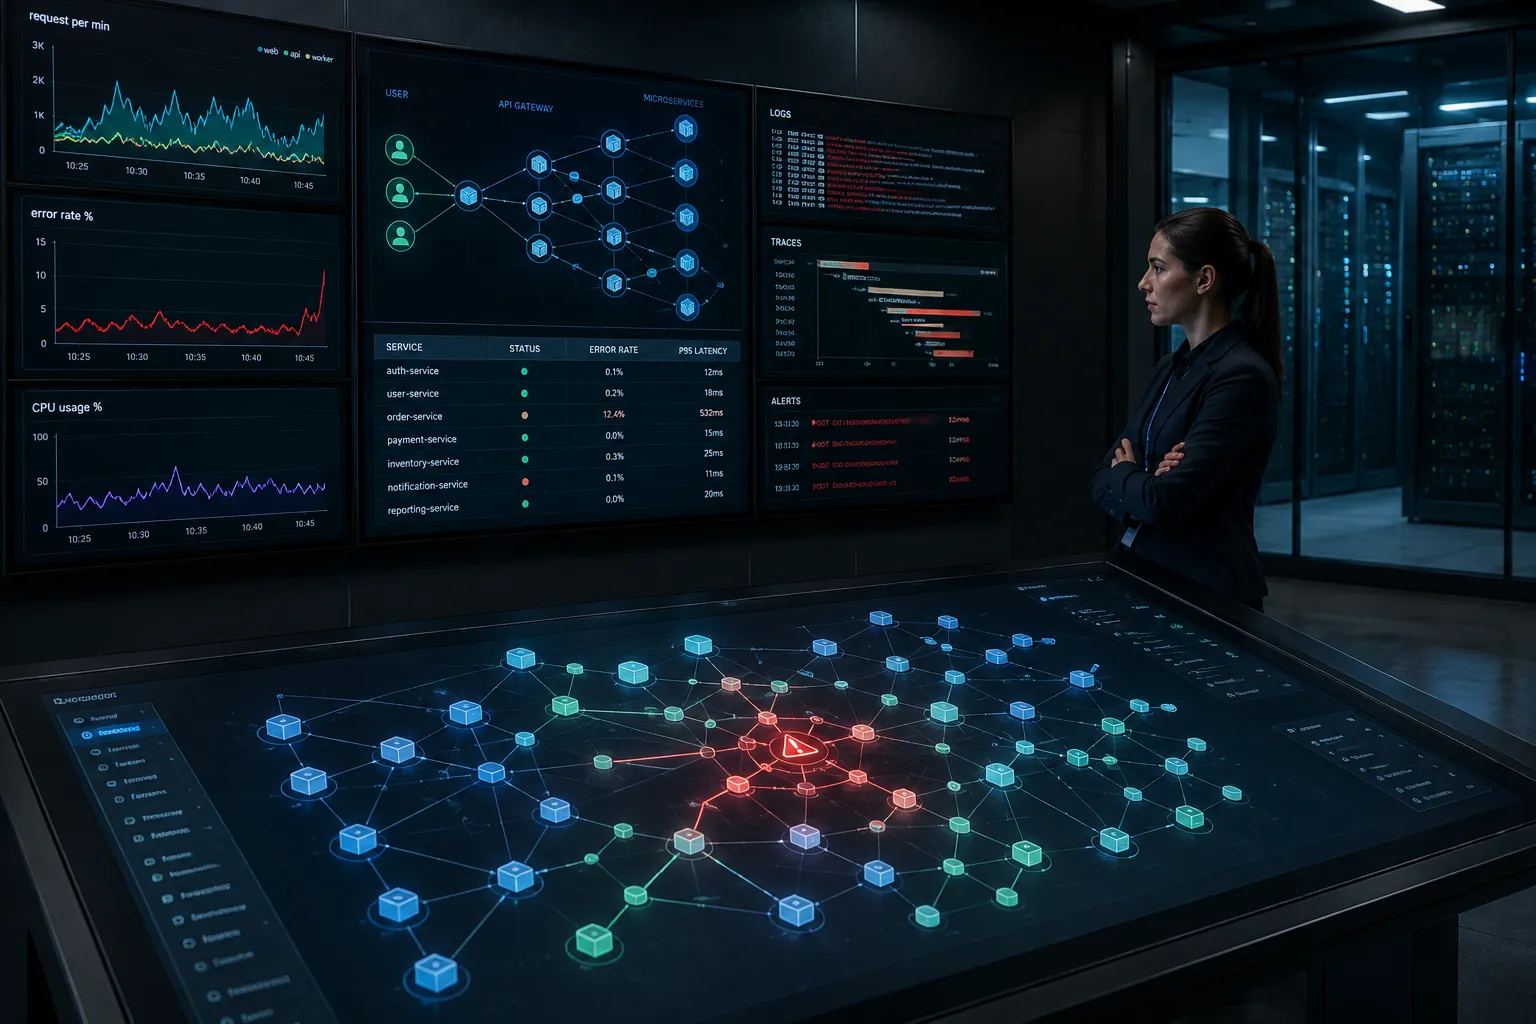
Monitoring collects predefined metrics and triggers alerts when thresholds are breached — it tells you "the API response time is high." Observability is the ability to understand system internal state from external outputs — it tells you "the API response time is high because database connection pool exhaustion in the payment service caused cascading timeouts in the order service." Observability enables debugging without prior knowledge of the failure mode.
Monitoring vs. Observability: The Critical Difference
Monitoring is reactive: you define what to watch (CPU, memory, latency, error rates) and set thresholds. When a threshold is breached, an alert fires. Monitoring answers "what is broken?" Observability is investigative: you instrument your system to emit rich, contextual data (structured logs, metrics with labels, distributed traces) that allow engineers to explore and ask questions they did not anticipate. Observability answers "why is it broken?"
Why Monitoring Falls Short for Microservices
A single user request in a microservices architecture may traverse 20-50 services. A failure in one service cascades through the system. Monitoring individual services shows each service is "healthy" (within thresholds) while the end-to-end user experience is degraded. Without correlating logs, metrics, and traces across the entire request path, the root cause remains hidden.
Key Challenges
Alert Fatigue
Monitoring generates thousands of alerts. Most are informational. Without context and correlation, teams ignore alerts or respond to symptoms rather than causes. Alert fatigue masks real incidents.
Data Silos
Logs go to ELK. Metrics go to Prometheus. Traces go to Jaeger. Each system is independent. Debugging requires manually correlating data across three systems — a time-consuming process that slows incident response.
Context Loss
Metrics without labels lack context. "API latency is 2 seconds" is less useful than "API latency is 2 seconds for the /checkout endpoint in the EU region for users on mobile devices." Context transforms metrics from noise into actionable insight.
Recommended Observability Framework
1. The Three Pillars — Unified
Deploy a platform that unifies logs, metrics, and traces in a single query surface. Options include Grafana Stack (Loki + Prometheus + Tempo), Datadog, New Relic, or Dynatrace. The key is correlation: click from a metric anomaly to the traces that caused it, then to the logs that explain why.
2. Structured Logging with Correlation IDs
Emit structured logs (JSON) with correlation IDs that tie log entries to specific requests. Every service in the request path logs with the same correlation ID. When debugging, filter logs by correlation ID to see the complete request journey across all services.
3. Distributed Tracing
Instrument services with OpenTelemetry for distributed tracing. Every inbound request generates a trace that follows the request through all downstream services. Traces reveal service dependencies, latency bottlenecks, and error propagation paths that metrics alone cannot show.
4. Service-Level Objectives (SLOs)
Define SLOs for critical user journeys: availability (99.9%), latency (p99 < 500ms), error rate (< 0.1%). SLOs focus alerting on user impact rather than system metrics. An SLO breach means users are affected; a metric anomaly may not be.
5. Observability-Driven Debugging Workflow
Train teams on the observability debugging workflow: start from SLO breach or user report, identify affected service via traces, drill into logs for the failing request, correlate with metrics for broader context, and root-cause through systematic exploration — not guessing.
| Aspect | Monitoring | Observability |
|---|---|---|
| Primary Question | What is broken? | Why is it broken? |
| Data Types | Predefined metrics | Logs, metrics, traces + context |
| Alert Approach | Threshold-based | SLO-based, user-impact focused |
| Debugging | Check dashboards | Explore, query, correlate |
| Microservices Support | Per-service metrics | Cross-service trace correlation |
| Unknown Issues | Cannot detect | Investigate via exploration |
Monitoring vs. observability capabilities and approaches
Practical Recommendations
- Deploy a unified observability platform (Grafana Stack, Datadog, or New Relic) that correlates logs, metrics, and traces.
- Implement structured logging with correlation IDs across all services.
- Instrument services with OpenTelemetry for distributed tracing.
- Define SLOs for critical user journeys and alert on SLO breaches.
- Train engineering teams on observability-driven debugging workflows.